wicked-problems
Aaron Tavel
Project maintained by aarontavel Hosted on GitHub Pages — Theme by mattgraham
Data Science Management Basics Lab 5 Pt. 1
Population Density
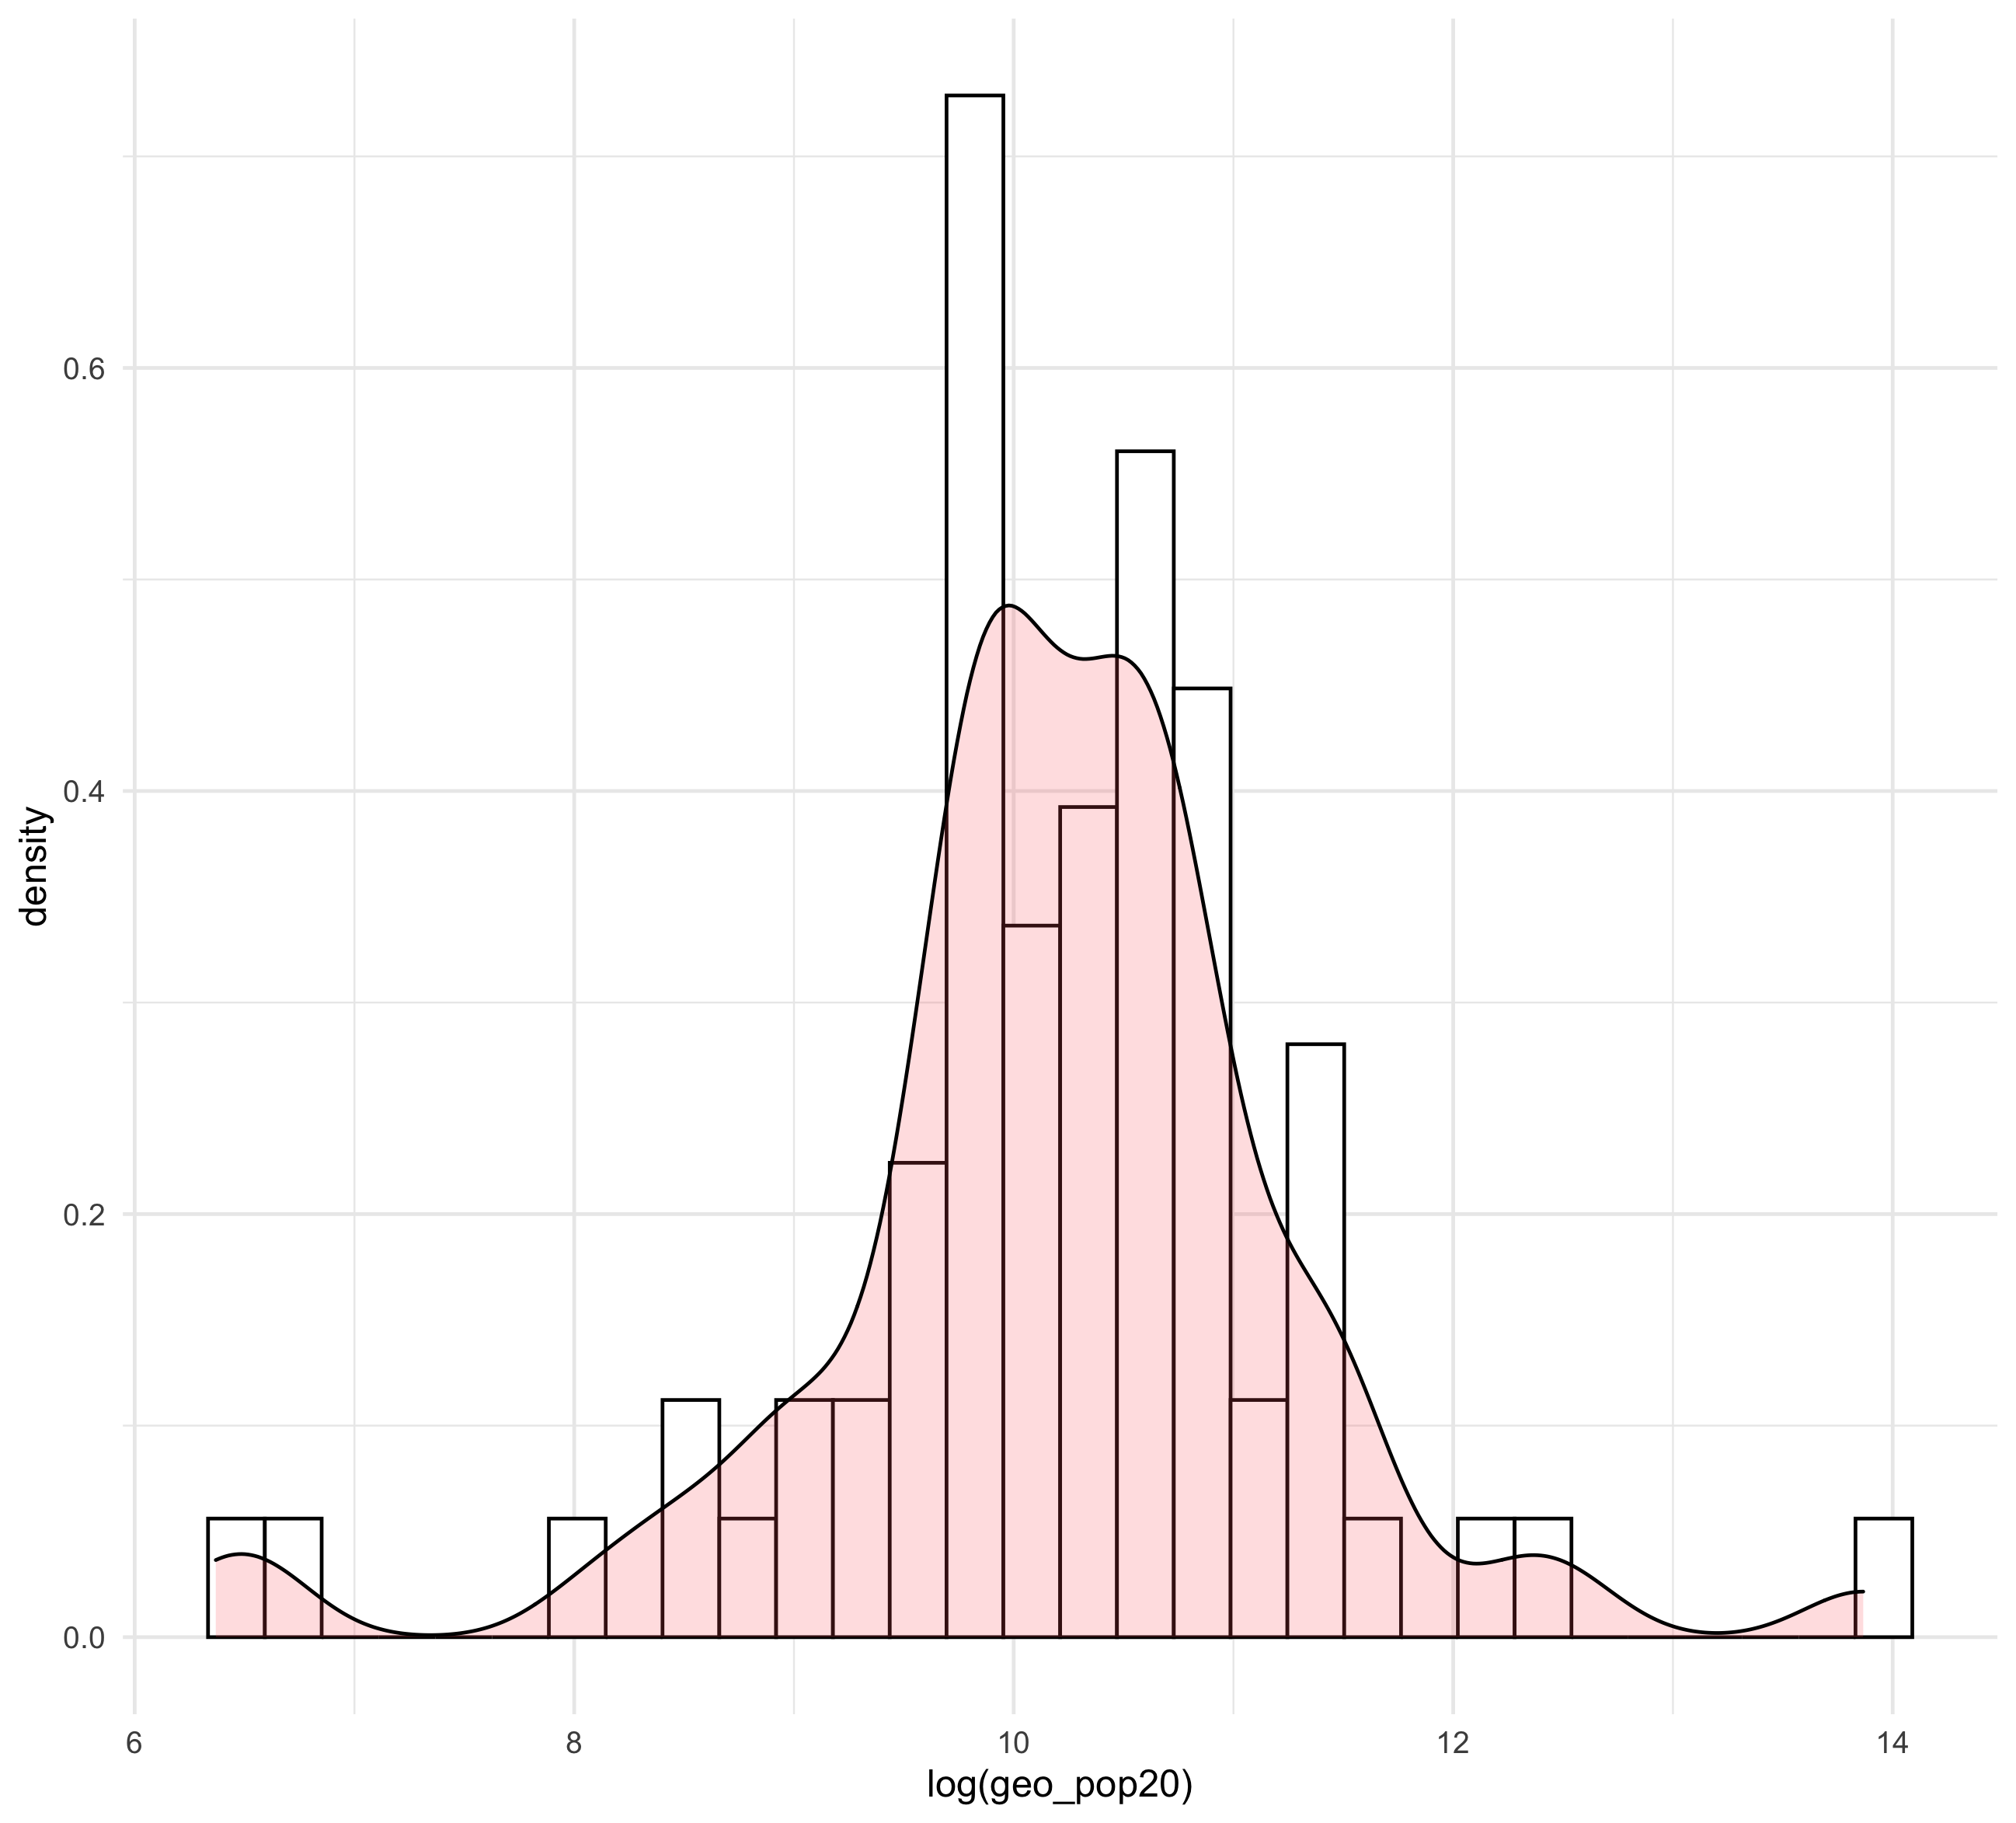 The plot depicts a historgram of the population density on top of a probability density function of Georgia.
Density of Water Geospatial Cover
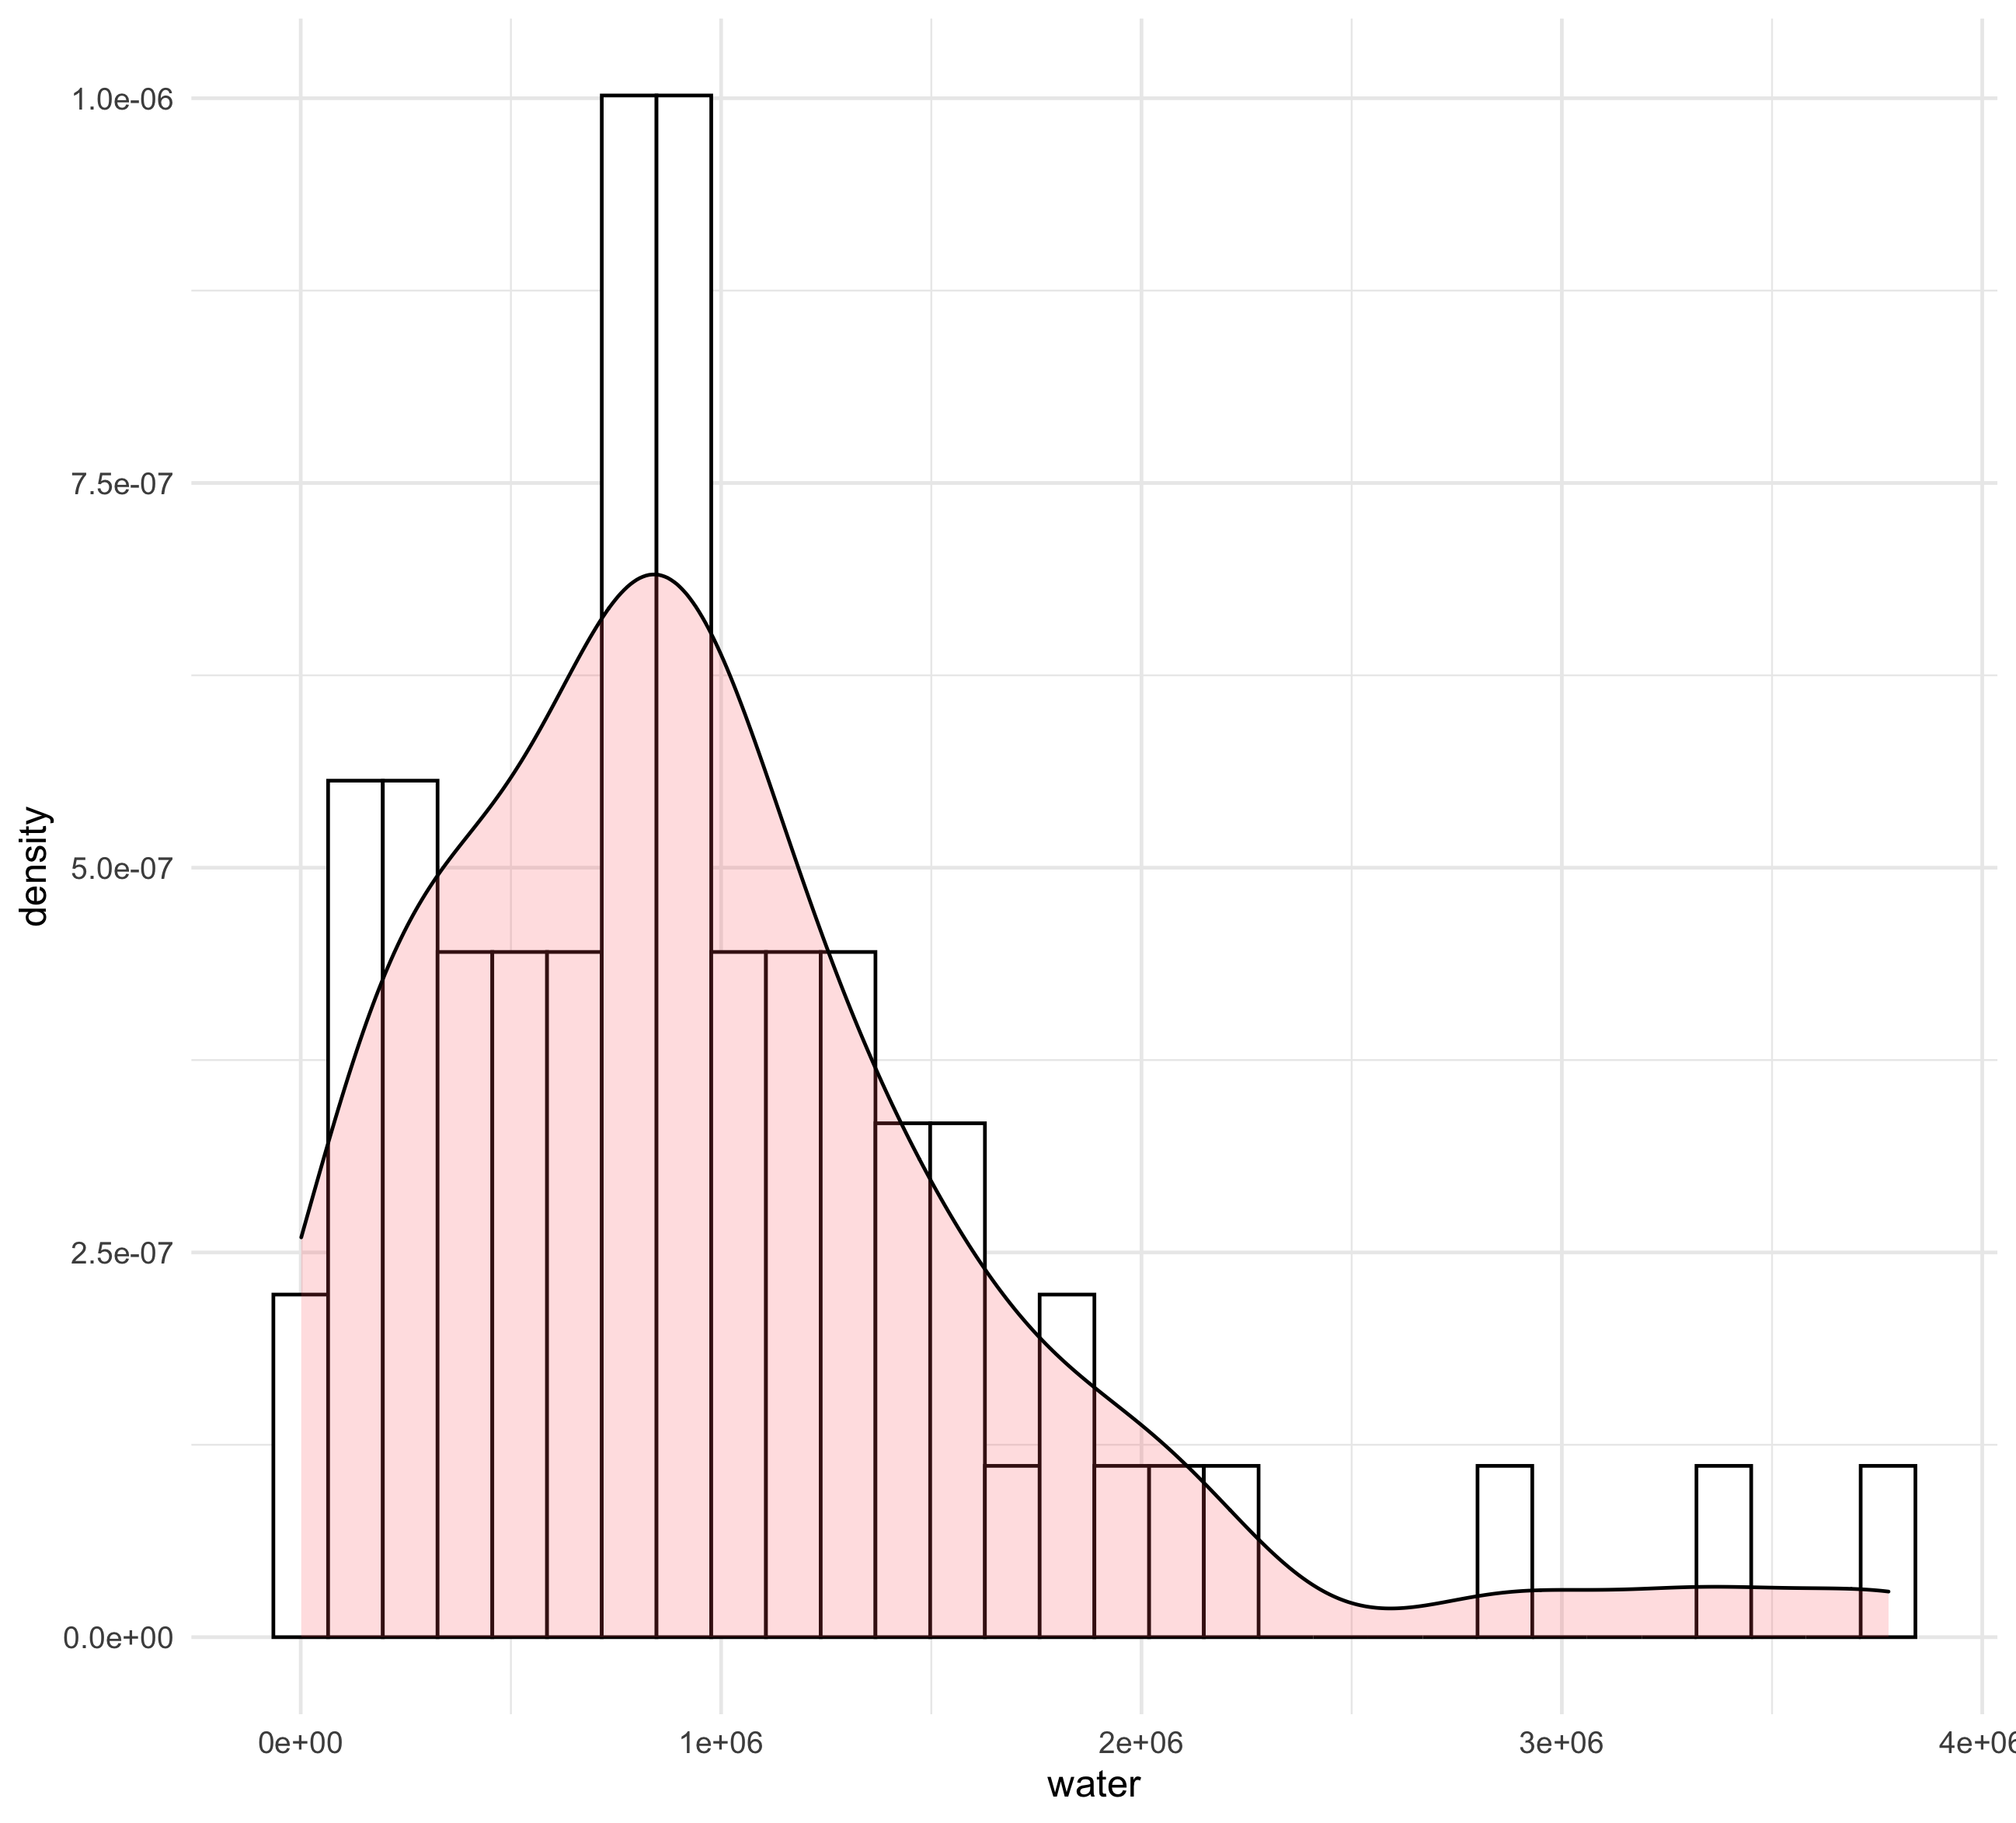
 The first plot depicts a historgram of the density of the water geospatial cover on top of a probability density function of Georgia’s water. The second plot depicts the density of water as a visual in the country of Georgia. Georgia’s adm2 boundaries are depicted, as well as the density of water in Georgia. Green indicates a higher density, and white indicates a lower density.
Density of Topographical Data

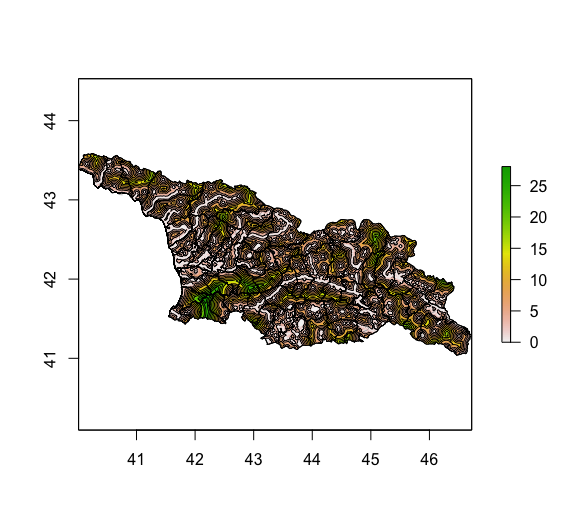
 The first plot depicts a historgram of the density of the topographical data on top of a probability density function of Georgia’s topography. The second plot depicts the topographical data as a visual in the country of Georgia. Georgia’s adm2 boundaries are depicted, as well as the topography of Georgia. Green indicates a higher density of topography, and white indicates a lower density.
Density Plot of Night Time Lights
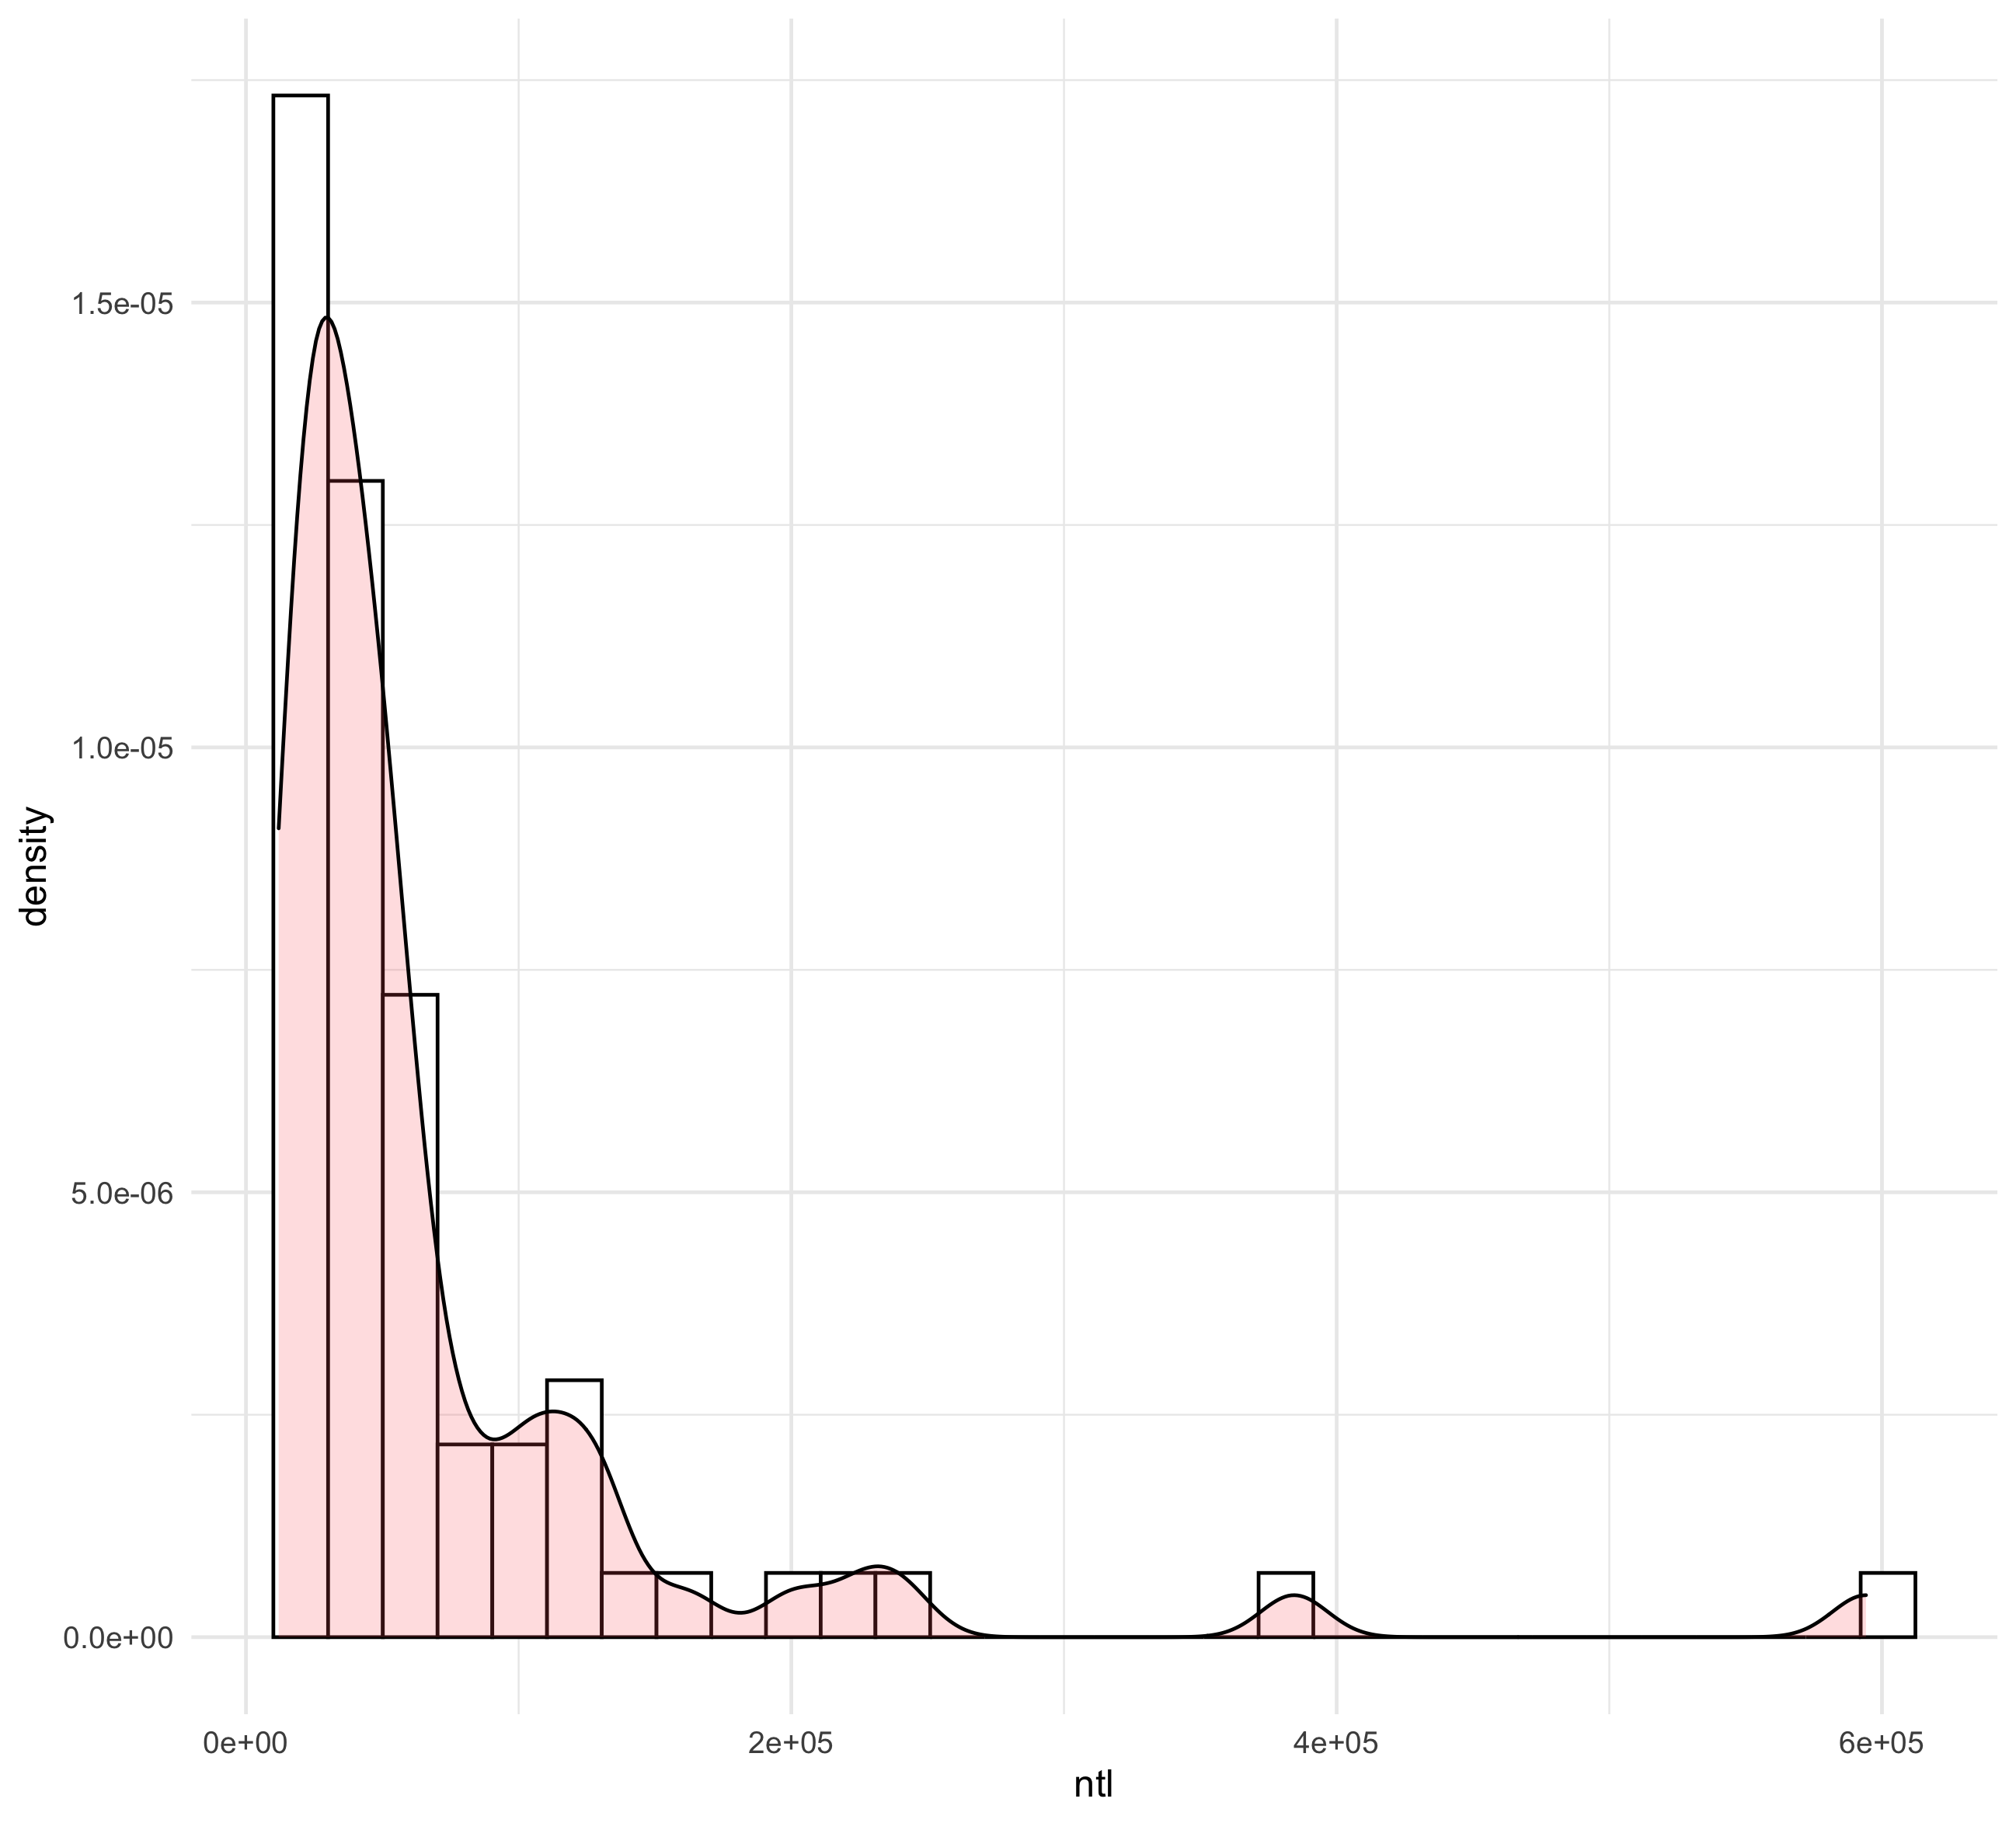
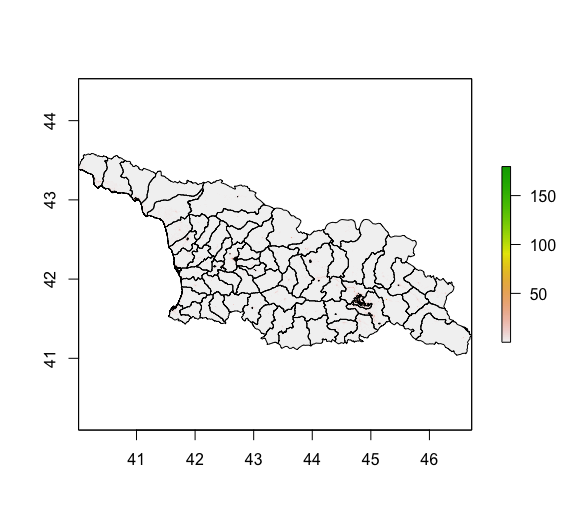 The first plot depicts a historgram of the density of the night time lights in Georgia on top of a probability density function of Georgia’s night time lights. The second plot depicts the night time lights as a visual in the country of Georgia. Georgia’s adm2 boundaries are depicted, as well as the density the night time lights in Georgia. Green indicates a higher density of the lights, and white indicates a lower density.